Hydrodynamic alterations induced by floating solar structures co-located with an offshore wind farm
Citation
Denis P, Capet A, Vanaverbeke J, Kerkhove TRH, Lacroix G and Legrand S (2025) Hydrodynamic alterations induced by floating solar structures co-located with an offshore wind farm. Front. Mar. Sci. 12:1674859. doi: 10.3389/fmars.2025.1674859
Abstract
Floating photovoltaic installations (FPV) are among the promising emerging marine renewable energy systems contributing to future global energy transition strategies. FPVs can be integrated within existing offshore wind farms, contributing to more efficient use of marine space. This complementarity has gained increasing attention as a sustainable approach to enhance green energy production while reducing offshore grid infrastructure costs, particularly in the North Sea. This study presents a first assessment to quantify the mid- and far-field hydrodynamic effects of FPVs (elevated design) deployed within an existing offshore wind farm (OWF) in the Belgian part of the North Sea. A subgrid-scale parameterization was adopted into the 3D hydrodynamic model COHERENS to assess impacts on four key hydrodynamic metrics: surface irradiance reduction due to shading, changes in current velocity fields, turbulent kinetic energy production, and variations in current-induced bottom shear stress. Four scenarios were compared: a baseline without structures, a scenario with only offshore wind turbines and two combined wind and photovoltaic configurations (sparse and dense). At farm scale, simulations showed small effects of FPV shading on sea surface temperature (< 0.1°C), but significant reductions in current speed, increased turbulent kinetic energy mainly beneath the floaters, and a noticeable impact on bottom shear stress. This hydrodynamic modeling study constitutes a first step toward a comprehensive environmental impact assessment of FPVs, particularly in relation to their biogeochemical effects on the water column and benthic habitats. The findings provide valuable insights to support sustainable marine spatial planning, environmental assessments, and industrial design strategies in the North Sea and beyond.
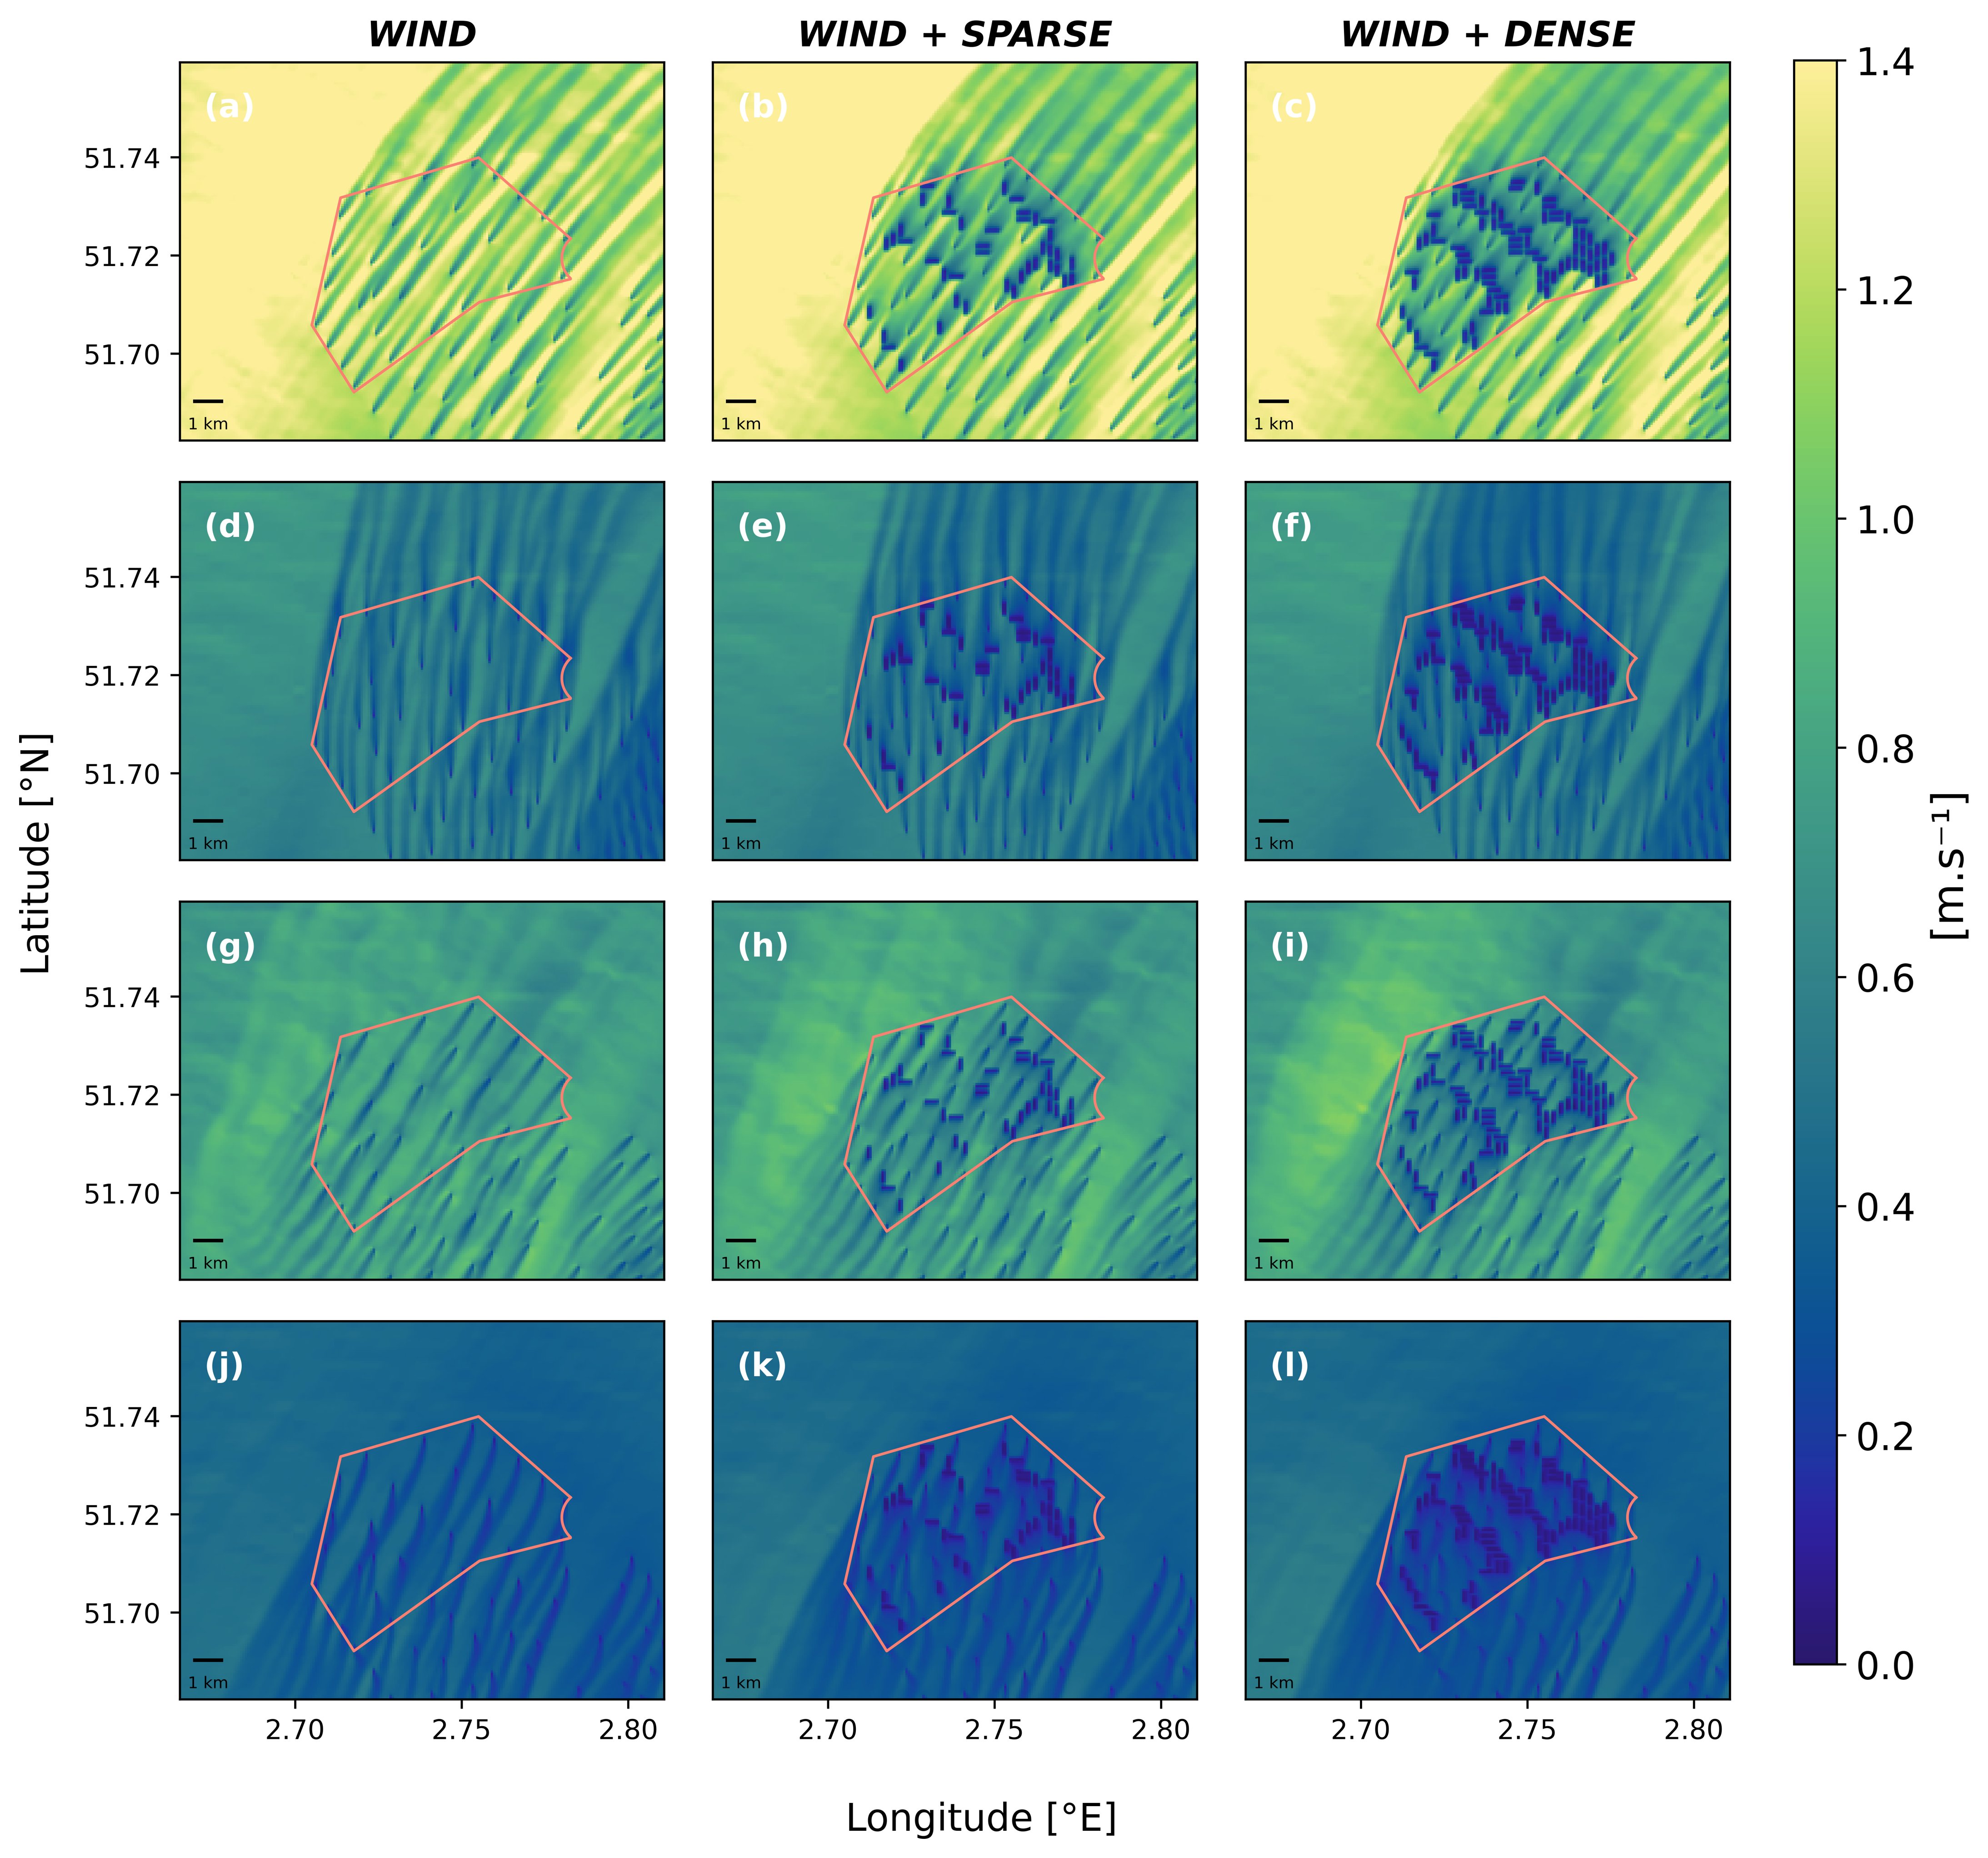
Surface current speed for different tidal moments and scenarios. Left: reference scenario with only offshore wind turbines (‘WIND’). Centre: scenario with wind turbines + FPV (‘WIND + SPARSE’). Right: scenario with wind turbines + FPV (‘WIND + DENSE’). (a–c) surface current speed at high tide (HT). (d–f) HT + 3 hours. (g–i) HT + 6 hours. (j–l) HT + 9 hours. The moment of the highest tide (HT) was selected using the surface elevation at the center of the domain i.e. 1.7 m of elevation on 15/01. Orange contours indicate the Mermaid wind farm concession area. This is Figure 4 in the paper.